Smart Tuning: Automatic controller optimization for higher process quality
Read min.

Baumüller Smart Value
Get more out of your drive technology with IoT: Baumüller Smart Value is all about the added value that smart drive technology gives mechanical engineers and machine operators. Baumüller Smart Value enhances the scope of our servo drives: It takes existing data, such as power, current, torque, speed and position, and provides users with important additional information (e.g. machine operating status) or decisions are made directly in the drive to prevent machine failures. The same can be said of the associated design software, which ensures that the motor / controller combination is optimally dimensioned for the respective application and the controller is parameterized. In addition, the design can be immediately verified and optimized on the digital twin using simulation technology.
The problem
The dynamics of a drive system – and thus the consistency of the machine’s process quality and productivity – is highly influenced by the setting of the parameters responsible for the control behavior. However, the determination of an optimally synchronized setting in the servo controller requires extensive specialized knowledge and lots of experience, which often proves to be very time-consuming during commissioning. Moreover, vibrations that occur if there are high dynamics in the system are problematic in many cases. These make the optimization additionally difficult.
The solution

With the drive-integrated “Smart Tuning” function, Baumüller enables high process quality and maximum output through self-optimization, which determines the optimum controller settings for the available controlled system. Since the settings of the controller mainly depend on the load inertia ratio between the servo motor and the driven load, the inertia of the system is determined first. To do this, the motor including the corresponding load are accelerated initially and are then braked again.
If the inertia of the system is known, the ProDrive analysis software is used to optimize the relevant parameters in the converter automatically. It is possible to continuously choose between two different controller settings: a soft, less dynamic through to a hard, very dynamic setting. In addition, existing friction torques are identified and are taken into consideration in the optimization.
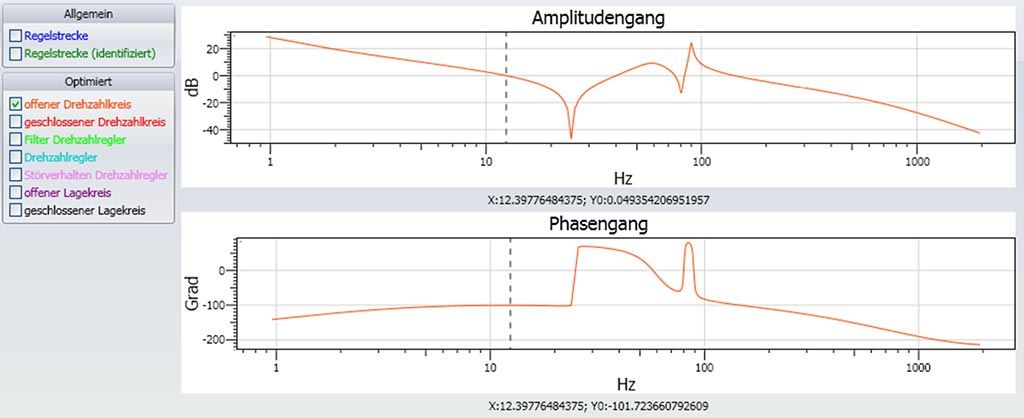
If this simple but nonetheless effective method is not sufficient to achieve an optimum result, the frequency response analysis (Bode plot) can be used for optimization in a further step. In this case, the controlled system is excited by a signal (e.g.: white noise) and the corresponding transfer behavior is determined.
Frequencies at which resonances occur are also identified. These can then be attenuated by filters, whose coefficients are calculated automatically. These filters can be used to compensate for the resonances.
Bode plot
The Bode plot shows the amplitude amplification and the phase shift of a transfer function depending on the frequency. It describes the relationship between a harmonic excitation at an input of the system and the corresponding output signal.
This type of plot is named after Hendrik Wade Bode and is frequently used in control engineering to illustrate the properties of the controlled system.

Frequency response analysis of a drive system for determining the optimum controller setting
The benefits
The automatic functions for inertia measurement and vibration analysis enable:
- Higher quality
- Higher output
- Time savings during commissioning
- Regular machine optimization

Jürgen Dlugosch
Senior Product Manager I Baumüller Nürnberg GmbH


